In technical analysis, candlestick patterns are used to predict the future direction of price movement.
In this article, we will discuss what is a candlestick and a few patterns which you should know so that an informed decision can be made during stock market investments.
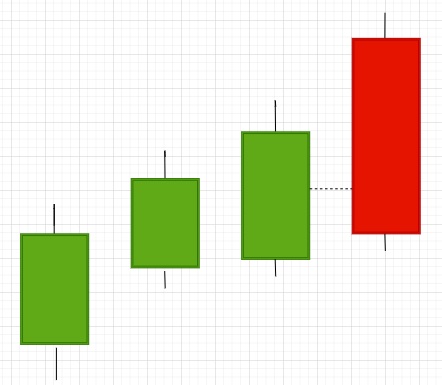
What is a candlestick?
Candlestick is a way to represent the movement of price graphically for a given period of time. They are generally formed by the opening, high, low, and closing prices of a financial instrument.
Candlestick has three basic features:
- Body – Body represents the open-to-close range.
- Wick/Shadow – Wick or shadow indicates the intra-day high and low.
- Colour – Colour reveals the direction of market movement like a green or white body indicates a price increase, while a red or black body shows a price decrease.
Hammer

Hammer pattern can be recognized by its short body and lower shadow that is about two or three times the length of the body and a shorter upper shadow or no shadow at all.
The hammer is usually a clear indicator of a declining price reversing its direction and starting to go up.
To be surer it is always good to wait for an additional confirmation such as a green candle closing above the open of hammer.
Bullish Engulfing

The bullish engulfing pattern consists of a red candle followed by a bigger green one, which fully engulfs the red candle.
This pattern is an indicator of a market turning point that is, the market may start going up and might be a good time to buy stock.
Morning Doji Star

The morning doji star pattern appears when there is a slight market movement. This consists of three candles, a red one followed by a doji which is followed by a green candle closing beyond the middle of the first candle. If the green candle is longer than the red one then the signal is more reliable.
Dark Cloud Cover
The dark cloud cover appears before the price dropdown. A long green candle is followed by a red one, that opens at a new high and closes below the middle of the green candle. To be surer, can wait for fo another smaller red candle to form and confirm.